Useful tools for the RGB-D benchmark
We provide a set of tools that can be used to pre-process the datasets and to evaluate the SLAM/tracking results. The scripts can be downloaded here.
To checkout the repository using subversion, run
svn checkout https://svncvpr.in.tum.de/cvpr-ros-pkg/trunk/rgbd_benchmark/rgbd_benchmark_tools
Associating color and depth images
The Kinect provides the color and depth images in an un-synchronized way. This means that the set of time stamps from the color images do not intersect with those of the depth images. Therefore, we need some way of associating color images to depth images.
For this purpose, you can use the ''associate.py'' script. It reads the time stamps from the rgb.txt file and the depth.txt file, and joins them by finding the best matches.
usage: associate.py [-h] [--first_only] [--offset OFFSET]
                    [--max_difference MAX_DIFFERENCE]
                    first_file second_file

This script takes two data files with timestamps and associates them

positional arguments:
  first_file            first text file (format: timestamp data)
  second_file           second text file (format: timestamp data)

optional arguments:
  -h, --help            show this help message and exit
  --first_only          only output associated lines from first file
  --offset OFFSET       time offset added to the timestamps of the second file
                        (default: 0.0)
  --max_difference MAX_DIFFERENCE
                        maximally allowed time difference for matching entries
                        (default: 0.02)
Evaluation
After estimating the camera trajectory of the Kinect and saving it to a file, we need to evaluate the error in the estimated trajectory by comparing it with the ground-truth. There are different error metrics. Two prominent methods is the absolute trajectory error (ATE) and the relative pose error (RPE). The ATE is well-suited for measuring the performance of visual SLAM systems. In contrast, the RPE is well-suited for measuring the drift of a visual odometry system, for example the drift per second.
For both metrics, we provide automated evaluation scripts that can be downloaded here. Note that there is also an online version available on our website. Both trajectories have to be stored in a text file (format: 'timestamp tx ty tz qx qy qz qw', more information). For comparison, we offer a set of trajectories from RGBD-SLAM.
Absolute Trajectory Error (ATE)
The absolute trajectory error directly measures the difference between points of the true and the estimated trajectory. As a pre-processing step, we associate the estimated poses with ground truth poses using the timestamps. Based on this association, we align the true and the estimated trajectory using singular value decomposition. Finally, we compute the difference between each pair of poses, and output the mean/median/standard deviation of these differences. Optionally, the script can plot both trajectories to a png or pdf file.
usage: evaluate_ate.py [-h] [--offset OFFSET] [--scale SCALE]
                       [--max_difference MAX_DIFFERENCE] [--save SAVE]
                       [--save_associations SAVE_ASSOCIATIONS] [--plot PLOT]
                       [--verbose]
                       first_file second_file

This script computes the absolute trajectory error from the ground truth
trajectory and the estimated trajectory.

positional arguments:
  first_file            first text file (format: timestamp tx ty tz qx qy qz
                        qw)
  second_file           second text file (format: timestamp tx ty tz qx qy qz
                        qw)

optional arguments:
  -h, --help            show this help message and exit
  --offset OFFSET       time offset added to the timestamps of the second file
                        (default: 0.0)
  --scale SCALE         scaling factor for the second trajectory (default:
                        1.0)
  --max_difference MAX_DIFFERENCE
                        maximally allowed time difference for matching entries
                        (default: 0.02)
  --save SAVE           save aligned second trajectory to disk (format: stamp2
                        x2 y2 z2)
  --save_associations SAVE_ASSOCIATIONS
                        save associated first and aligned second trajectory to
                        disk (format: stamp1 x1 y1 z1 stamp2 x2 y2 z2)
  --plot PLOT           plot the first and the aligned second trajectory to an
                        image (format: png)
  --verbose             print all evaluation data (otherwise, only the RMSE
                        absolute translational error in meters after alignment
                        will be printed)
Relative Pose Error (RPE)
For computing the relative pose error, we provide a script ''evaluate_rpe.py''. This script computes the error in the relative motion between pairs of timestamps. By default, the script computes the error between all pairs of timestamps in the estimated trajectory file. As the number of timestamp pairs in the estimated trajectory is quadratic in the length of the trajectory, it can make sense to downsample this set to a fixed number (–max_pairs). Alternatively, one can choose to use a fixed window size (–fixed_delta). In this case, each pose in the estimated trajectory is associated with a later pose according to the window size (–delta) and unit (–delta_unit). This evaluation technique is useful for estimating the drift.
usage: evaluate_rpe.py [-h] [--max_pairs MAX_PAIRS] [--fixed_delta]
                       [--delta DELTA] [--delta_unit DELTA_UNIT]
                       [--offset OFFSET] [--scale SCALE] [--save SAVE]
                       [--plot PLOT] [--verbose]
                       groundtruth_file estimated_file

This script computes the relative pose error from the ground truth trajectory
and the estimated trajectory.

positional arguments:
  groundtruth_file      ground-truth trajectory file (format: "timestamp tx ty
                        tz qx qy qz qw")
  estimated_file        estimated trajectory file (format: "timestamp tx ty tz
                        qx qy qz qw")

optional arguments:
  -h, --help            show this help message and exit
  --max_pairs MAX_PAIRS
                        maximum number of pose comparisons (default: 10000,
                        set to zero to disable downsampling)
  --fixed_delta         only consider pose pairs that have a distance of delta
                        delta_unit (e.g., for evaluating the drift per
                        second/meter/radian)
  --delta DELTA         delta for evaluation (default: 1.0)
  --delta_unit DELTA_UNIT
                        unit of delta (options: 's' for seconds, 'm' for
                        meters, 'rad' for radians, 'f' for frames; default:
                        's')
  --offset OFFSET       time offset between ground-truth and estimated
                        trajectory (default: 0.0)
  --scale SCALE         scaling factor for the estimated trajectory (default:
                        1.0)
  --save SAVE           text file to which the evaluation will be saved
                        (format: stamp_est0 stamp_est1 stamp_gt0 stamp_gt1
                        trans_error rot_error)
  --plot PLOT           plot the result to a file (requires --fixed_delta,
                        output format: png)
  --verbose             print all evaluation data (otherwise, only the mean
                        translational error measured in meters will be
                        printed)
Generating a point cloud from images
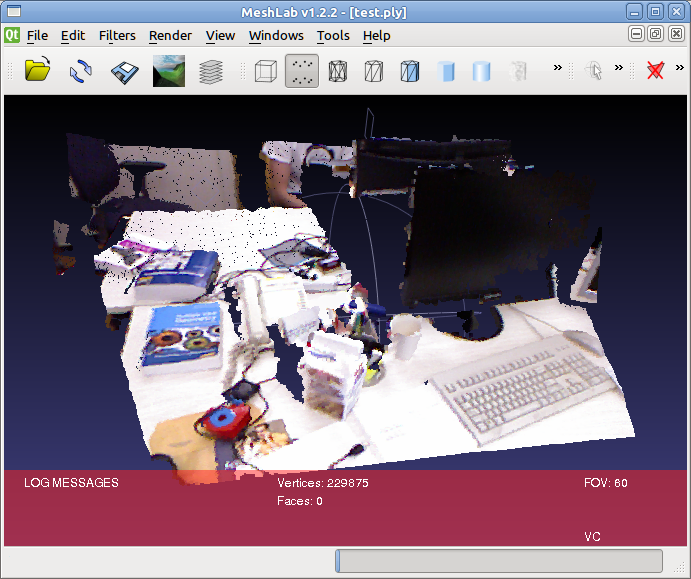
The depth images are already registered to the color images, so the pixels in the depth image already correspond one-to-one to the pixels in the color image. Therefore, generating colored point clouds is straight-forward. An example script is available in ''generate_pointcloud.py'', that takes a color image and a depth map as input, and generates a point cloud file in the PLY format. This format can be read by many 3D modelling programs, for example meshlab. You can download meshlab for Windows, Mac and Linux.
usage: generate_pointcloud.py [-h] rgb_file depth_file ply_file

This script reads a registered pair of color and depth images and generates a
colored 3D point cloud in the PLY format.

positional arguments:
  rgb_file    input color image (format: png)
  depth_file  input depth image (format: png)
  ply_file    output PLY file (format: ply)

optional arguments:
  -h, --help  show this help message and exit
Adding point clouds to ROS bag files
On the download page, we already provide ROS bag files with added point clouds for the datasets for visual inspection in RVIZ. Because of the large size of the resulting files, we downsampled these bag files to 2 Hz. In case that you want to generate ROS bag files that contain the point clouds for all images (at 30 Hz), you can use the ''add_pointclouds_to_bagfile.py'' script.
usage: add_pointclouds_to_bagfile.py [-h] [--start START]
                                     [--duration DURATION] [--nth NTH]
                                     [--skip SKIP] [--compress]
                                     inputbag [outputbag]

This scripts reads a bag file containing RGBD data, adds the corresponding
PointCloud2 messages, and saves it again into a bag file. Optional arguments
allow to select only a portion of the original bag file.

positional arguments:
  inputbag             input bag file
  outputbag            output bag file

optional arguments:
  -h, --help           show this help message and exit
  --start START        skip the first N seconds of input bag file (default:
                       0.0)
  --duration DURATION  only process N seconds of input bag file (default: off)
  --nth NTH            only process every N-th frame of input bag file
                       (default: 15)
  --skip SKIP          skip N blocks in the beginning (default: 1)
  --compress           compress output bag file
Visualizing the datasets in RVIZ
RVIZ is the standard visualization tool in ROS. It can be easily adapted to display many different messages. In particular, it can be used to display the point clouds from a ROS bag file. For this, run (in three different consoles)
roscore
rosrun rviz rviz
rosbag play rgbd_dataset_freiburg1_xyz-2hz-with-pointclouds.bag
If this is the first launch, you will have to enable the built-in displays (Menu –> Plugins –> Check "Loaded" for the builtin plugins). In the displays tab, set the "fixed frame" to "/world". Click on "Add", and select the PointCloud2 display, and set topic to "/camera/rgb/points". To show the colors, change "color transformer" to "RGB8" in the point cloud display and the "style" to "points". If you want, you can set the decay time to a suitable value, for example 5 seconds, to accumulate the points in the viewer as they come in. The result should then look as follows:


